Introduction
Cleaning and transforming raw data are a crucial step in creating accurate and insightful Power BI reports. The Power Query Editor in Power BI Desktop offers a robust set of tools for shaping data to meet specific needs. Here’s a step-by-step guide to help clean raw data in Power BI.
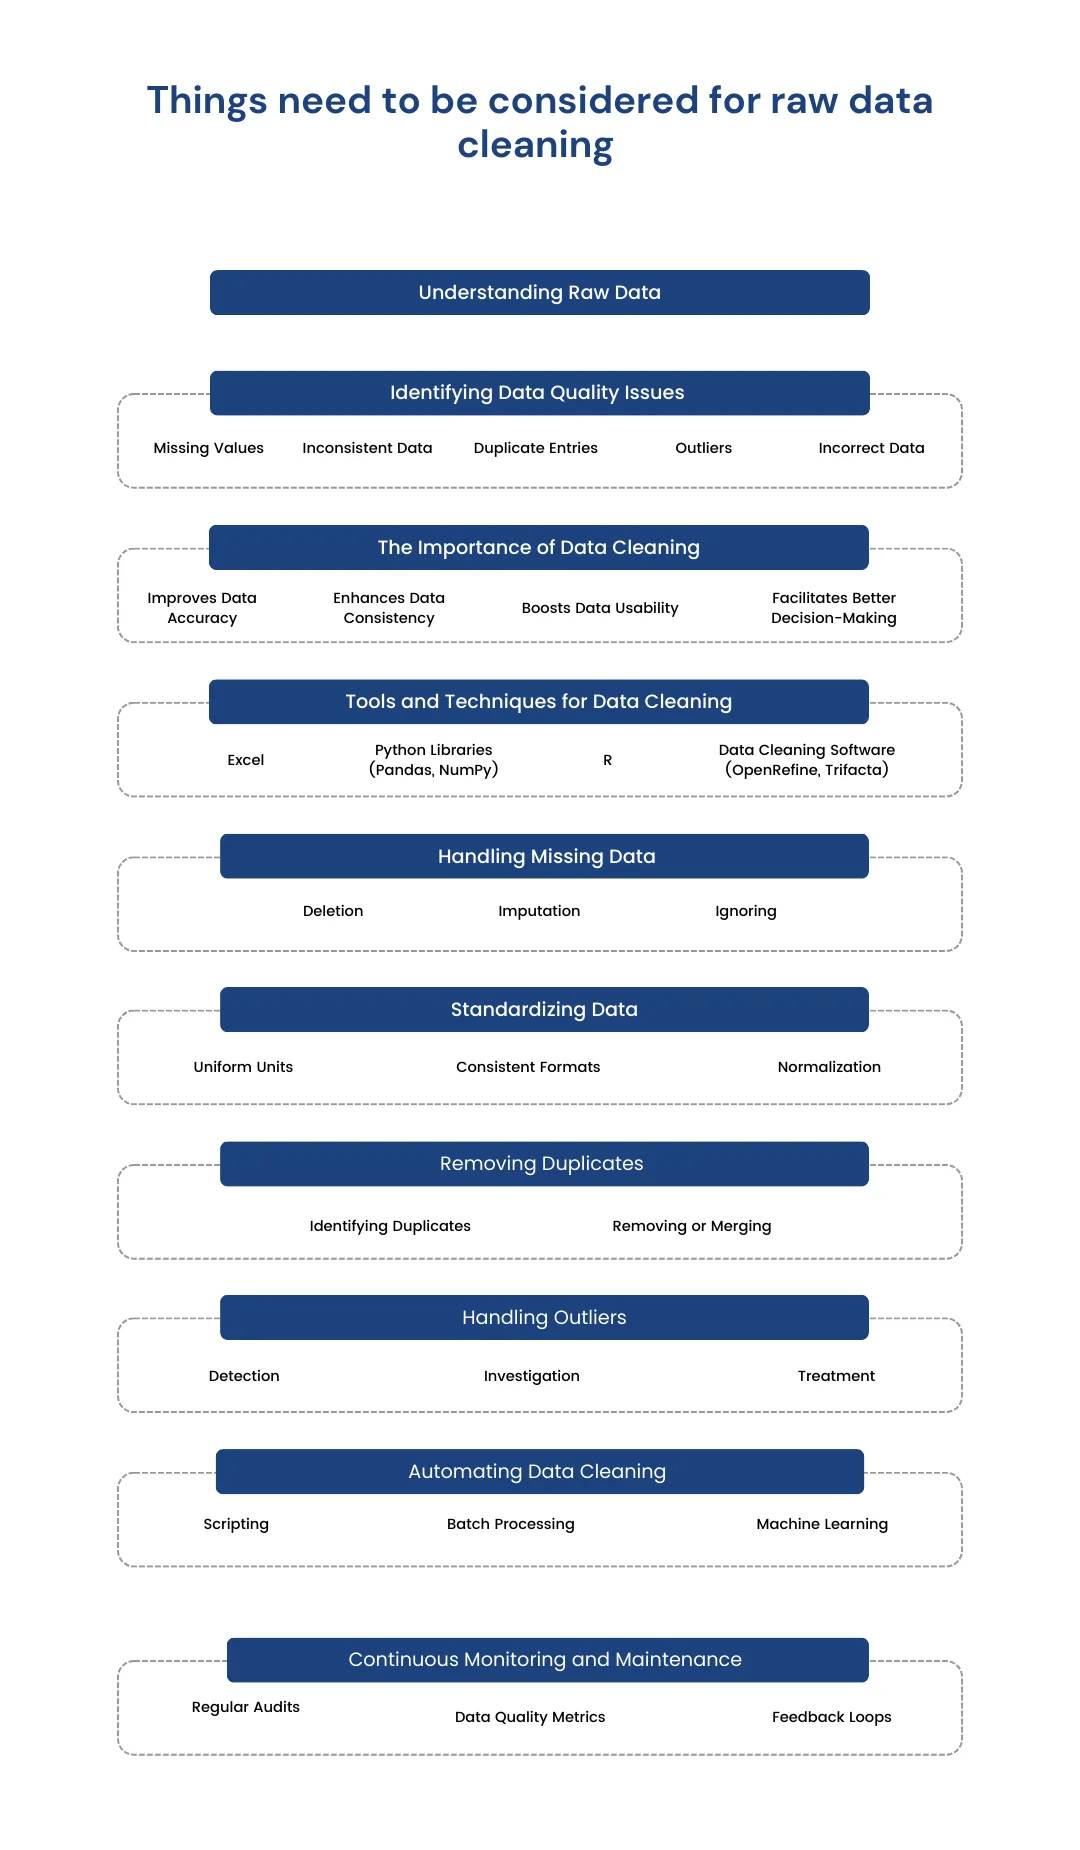
Things need to be considered while cleaning raw data
Steps and procedure to clean raw data (General Overview)

Getting started to clean Initial raw data in Power Query in Power BI
To begin cleaning data, open Power Query Editor by selecting the Transform data option on the Home tab of Power BI Desktop. In Power Query Editor, the data in the selected query displays in the middle of the screen. The Queries pane on the left lists the available queries (tables). All steps taken to shape data are recorded and applied each time the query connects to the data source. This ensures data is consistently shaped according to specifications without altering the original data source.
Identify Column Headers and Names
First, identify the column headers and names within the data and evaluate their placement to ensure they are correctly located. If the data imported does not have the correct headers, it can be difficult to read and analyze.
Promote Headers
If the first row of data contains column names, promote this row to be the header. This can be done by selecting the Use First Row as Headers option on the Home tab or by selecting the drop-down button next to Column1 and then selecting Use First Row as Headers.
Rename Columns
Examine the column headers to ensure they are correct, consistent, and user-friendly. To rename a column, right-click the header, select Rename, edit the name, and press Enter. Alternatively, double-click the column header and overwrite the name.
Remove Top Rows
Remove some of the top rows if they are blank or contain data that is not needed. Select Remove Rows > Remove Top Rows on the Home tab to remove these rows.
Remove Unnecessary Columns
Removing unnecessary columns early in the process helps focus on the data needed and improves the performance of Power BI models and reports. Remove columns by selecting the columns to remove and then selecting Remove Columns on the Home tab. Alternatively, select the columns to keep and then select Remove Columns > Remove Other Columns.
Unpivot Columns
Unpivoting columns can be useful when transforming flat data into a format that is easier to analyze. Highlight the columns to unpivot, select the Transform tab, and then select Unpivot Columns. Rename the resulting columns to appropriate names.
Pivot Columns
The pivot column feature converts flat data into a table that contains an aggregate value for each unique value in a column. Select Transform > Pivot Columns and choose the column to pivot. Choose an aggregate function such as count, minimum, maximum, median, average, or sum.
How to simplify data structure in Power BI
Rename Queries
Rename uncommon or unhelpful query names to more user-friendly names. Right-click the query in the Queries pane, select Rename, and edit the name.
Replace Values
Use the Replace Values feature to replace any value in a selected column with another value. Select the column, then Replace Values on the Transform tab, enter the value to find and the value to replace it with, and select OK.
Replace Null Values
If the data contains null values, consider replacing them with a value like zero to ensure accurate calculations. Use the same steps as replacing values to replace null values.
Remove Duplicates
To keep only unique names in a selected column, use the Remove Duplicates feature. Select the column, right-click the header, and select Remove Duplicates. Consider copying the table before removing duplicates for comparison.
Best Practices for Naming Tables, Columns, and Values
Consistent naming conventions help avoid confusion. Use descriptive business terms and replace underscores with spaces. Be consistent with abbreviations and avoid acronyms in values to ensure clarity.
By following these steps and best practices, effectively clean and transform raw data in Power BI, setting the stage for creating powerful and insightful reports.
Evaluate and Change Column Data Types
Why Correct Data Types Matter
When importing a table into Power BI Desktop, it automatically scans the first 1,000 rows to detect data types. However, this process can sometimes result in incorrect data type detection, leading to performance issues and calculation errors. Incorrect data types can prevent accurate calculations, deriving hierarchies, or establishing proper relationships between tables. For instance, a column intended for date values but detected as text will hinder time-based calculations and prevent the creation of date hierarchies.
Changing Data Types in Power Query Editor
To ensure data types are correct:
Open Power Query Editor: In Power BI Desktop, go to the Home tab and select Transform Data.
Select the column: Choose the column with the incorrect data type.
Change the Data Type: Change the data type by:
Selecting Data Type in the Transform tab and choosing the correct type.
Clicking the data type icon next to the column header and selecting the correct type from the list.
Combine Multiple Tables into a Single Table
When to Combine Tables
Combining tables is useful in scenarios such as:
Simplifying overly complex models.
Merging tables with similar roles.
Consolidating columns from different tables for custom analysis.
Methods to Combine Tables
Append Queries
Appending queries adds rows from one table to another:
Reformat Tables: Ensure columns in the tables to append have the same names and data types.
Append Queries as New: In Power Query Editor, go to the Home tab, select Append Queries as New, and add the tables to append.
Merge Queries
Merging queries combines data based on a common column:
Select Merge Queries as New: In Power Query Editor, choose Merge Queries as New.
Choose tables and columns: Select the tables and the common column (e.g., OrderID) to merge on.
Choose Join Type: Select a join type (e.g., left-outer) to define how tables are combined.
These methods allow creating a consolidated table for comprehensive analysis
Profile Data in Power BI
Understanding Data Profiling
Profiling data involves examining the structure and statistics of data to identify anomalies and ensure data quality.
Steps to Profile Data
Select View tab and enable Column Distribution, Column Quality, and Column Profile under the View tab in Power Query Editor.
Column Quality: Shows percentages of valid, error, and empty data.
Column Distribution: Displays distinct and unique values count.
Column Profile: Provides detailed statistics like row count, min/max values, and value distribution.
By examining these profiles, identify and address outliers or errors in the data. For example, unexpected values in a numeric column can highlight data entry errors.
After profiling and making necessary adjustments, select Close & Apply to implement these changes in Power BI Desktop. The data will now be clean and ready for accurate reporting and analysis.
Use Advanced Editor to Modify M Code
Understanding M Code
Each time data is shaped in Power Query, a step is created in the Power Query process. These steps are written in the M language behind the scenes and can be viewed and modified in the Advanced Editor.
Modifying M Code
Open Advanced Editor: In Power Query Editor, go to the View tab and select Advanced Editor.
View M Code: Each step created in Power Query is represented as a line of M code.
Edit M Code: Directly modify the M code to make changes. For example, if the name of a database needs to be changed, do it in the code and then select Done.
M code is written top-down, with later steps referring to previous ones by their variable names. Be careful when reordering steps, as it could disrupt dependencies. The final step in the query is typically the one used as the result for the data set.
These changes are saved as a step in the Power Query Editor, ensuring they are applied every time the data is refreshed. After making all necessary changes, select Close & Apply to apply these transformations.
Conclusion
Cleaning and transforming raw data in Power BI is essential for creating accurate and insightful reports. Using the Power Query Editor, data can be efficiently shaped through the above mentioned steps. By following these steps, a robust foundation for data analysis and reporting is established.
Why Sparity for Power BI Expertise?
Sparity stands as a trusted partner in leveraging Power BI for business intelligence needs. With a deep expertise in data transformation, Sparity excels in cleaning and transforming raw data, ensuring that reports are built on accurate and high-quality data. Customized solutions are tailored to meet unique business requirements, aligning data models and reports with specific goals. Advanced analytics capabilities enable deeper insights from data, driving more informed decision-making. Sparity provides continuous support and training to maximize the value of Power BI investments.
FAQs
What is data modeling, and what are the different types of data modeling techniques?
Data modeling is the process of creating a visual representation of data structures and relationships to facilitate understanding, communication, and analysis within an organization’s database systems, enabling effective decision-making and system design. Click here to learn all the data modeling techniques. Read more
What are the top 10 data analytics tools in 2024?
Unlock the power of data analytics tools with Sparity. Expertise in Power BI, Tableau, SAS, Apache Spark, and more. Drive insights for your business. Click here to learn about each tool comprehensively. Read more
What is Microsoft Fabric?
Microsoft Fabric serves as a comprehensive analytics solution tailored for enterprises, encompassing a wide spectrum from data movement and data science to real-time analytics and business intelligence. Click here for the comprehensive guide. Read more
How is copilot useful in Power BI?
Integration of generative AI capabilities for Copilot in Power BI enhances NLPs and code generation for efficient data analysis and visualization. Click here for complete guide on Copilot inPower BI
What are the types of security in Power BI?
Learn about the Power BI security best practices to protect your valuable data. Discover the importance of user authentication, ADD integration, user permissions, row-level security, object-level security, and more. Read more